CFD wind speed data analysis: comparison of 4 types of visualization techniques
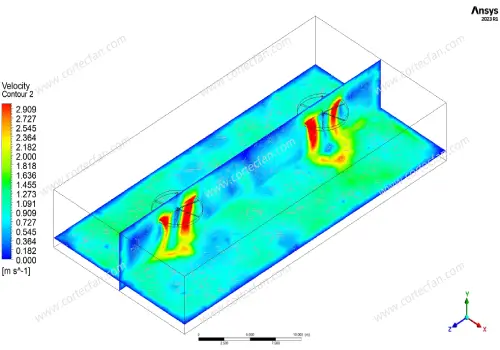
1. Contour map
Data range: 0–2.909 m/s
Key features:
- Stepped wind speed stratification (16 levels)
- High proportion of low-speed areas (≤0.545 m/s accounts for 50%)
Application scenario: Identify ventilation dead corners (such as 0 m/s area)

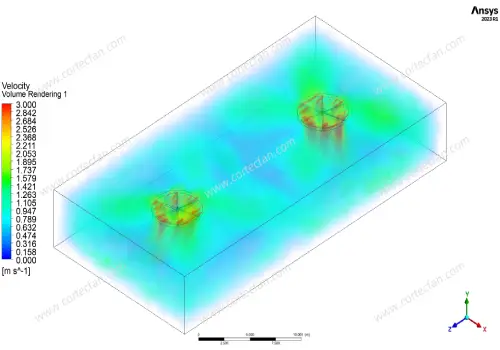
2. Volume Rendering
Data range: 0–3.000 m/s
Key features:
- Higher resolution (20 levels of stratification)
- Concentrated in medium and high speed areas (1.421–2.842 m/s accounts for 40%)
Application scenario: Dynamic analysis of airflow in three-dimensional space

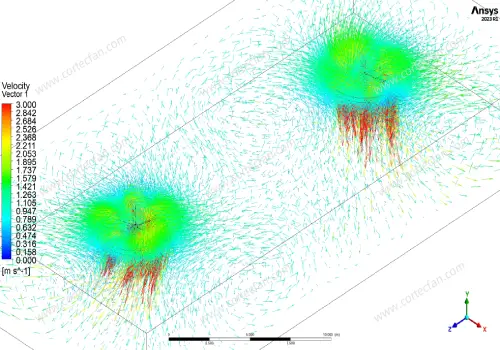
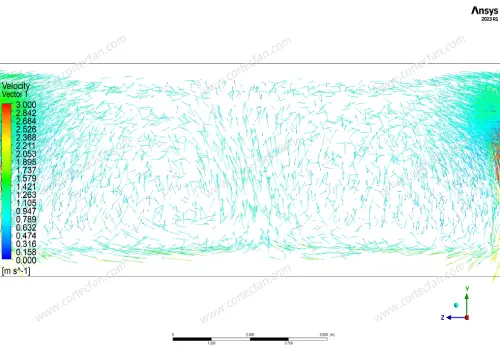
3. Vector
Data range: 0–3.000 m/s
Key features:
Direction + speed dual-dimensional data
Turbulence zone markers (such as 1.268 m/s mutation point)
Application scenario: Optimize fan angle and spoiler control
Data insights: All simulations show a steep drop in wind speed gradient (3 m/s → 0 m/s), indicating that there is a significant airflow attenuation area, and the fan layout needs to be optimized in a targeted manner


Engineering optimization strategy: from CFD results to wind turbine selection
Question 1: How to reduce the "zero wind speed dead zone"?
Solution:
Add auxiliary fans in the area ≤0.5 m/s (based on the contour map)
Select high wind pressure models (break through static pressure resistance)
Question 2: Why is the wind speed up to the standard but the feeling is not good?
Root cause analysis: The vector diagram shows that the airflow direction is turbulent (such as turbulence in the 1.895 m/s area)
Countermeasures: Install guide vanes or use axial fans (stabilize the airflow path)
Question 3: How to balance energy consumption and wind speed uniformity?
Data-driven decision:
| Wind speed range (m/s) | Volume rendering ratio | Optimization suggestions |
| >2.0 | 35% | Reduce fan speed |
| 0.5–2.0 | 45% | Maintain current configuration |
| <0.5 | 20% | Increase local air outlets |
Extended Q&A: People Also Ask
Q1: How much influence does CFD wind speed simulation have on wind turbine selection?
A: CFD data can reduce the selection error rate by 30%. For example: when the volume rendering shows that the area >2.5 m/s exceeds 40%, it is necessary to switch to a high-volume, low-pressure model (to avoid energy waste).
Q2: What is the meaning of the arrow direction in the wind speed vector diagram?
A: The direction of the arrow reflects the actual path of the airflow. If backflow occurs (such as the 1.106 m/s reverse vector in FFF5_1), the fan installation angle needs to be adjusted or a baffle needs to be added.
Q3: What is the minimum wind speed requirement for industrial plant ventilation?
Answer: According to OSHA standards, the continuous wind speed in the work area is ≥ 0.5 m/s (refer to the safety zone above 0.545 m/s in the contour map).
Conclusion: The golden rule of precision ventilation
CFD visualization is not only a technical demonstration, but also a diagnostic tool for airflow systems. By decoding the wind speed distribution map:
1. Locate dead spots → Targeted air supply
2. Analyze vectors → Suppress turbulent dissipation
3. Layered management → Achieve on-demand air supply
To obtain customized CFD analysis reports, please visit (www.cortecfan.com)
#Cortec Fan


